
ChatGPT-4o
Cinematic
Published Oct 31, 2026
AI History Chronological Atlas Infographic
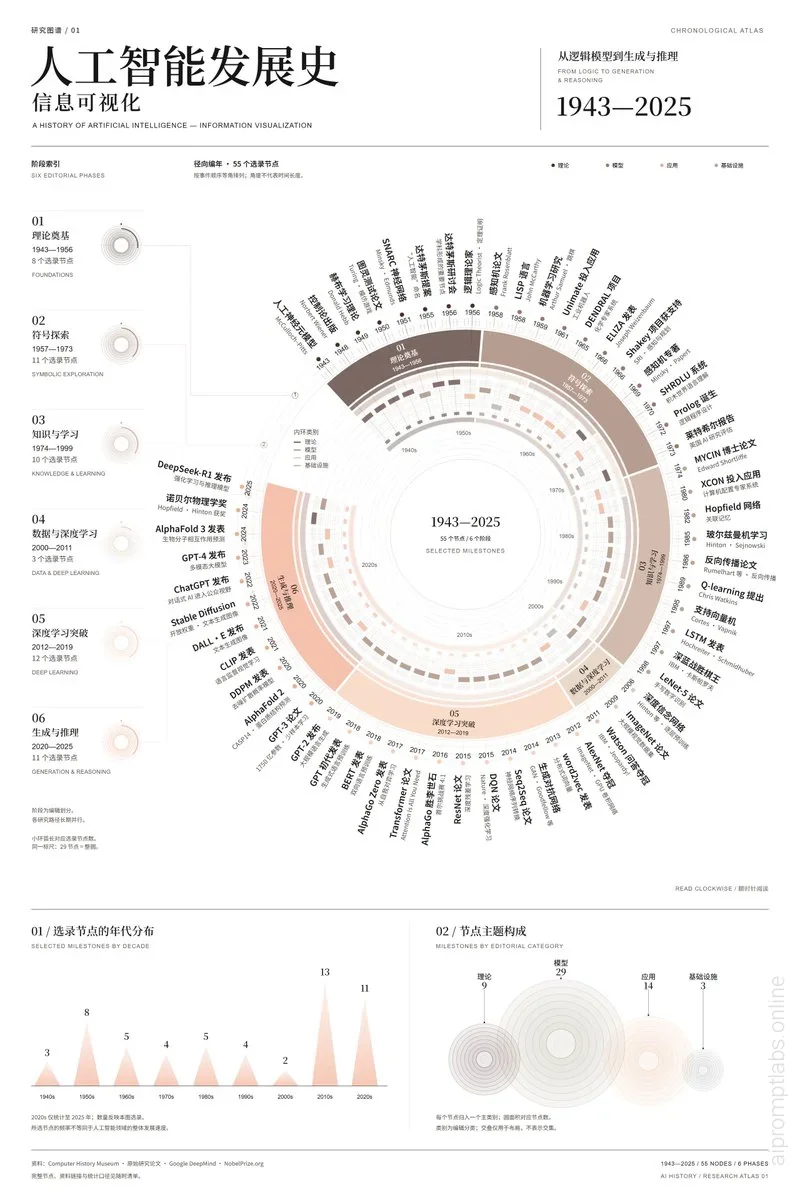
A detailed vertical infographic visualizing the timeline of Artificial Intelligence development from 1943 to 2025 using a radial chart and statistical breakdowns. - YouMind

Ai Prompt Labs
@admin • Prompt Engineer
Prompt Instruction Payload
Goal: Create a sophisticated, high-density chronological atlas infographic visualizing the history of Artificial Intelligence from 1943 to 2025.
Canvas: Vertical layout with a clean, academic aesthetic. Background is off-white/light gray. Primary colors are muted earth tones (terracotta, beige, dark brown) and black text.
Layout: The design is divided into three main sections: a header, a central radial visualization, and a footer with statistical breakdowns.
Header Section:
- Top Left: Large Chinese title "人工智能发展史" (History of AI), subtitle "信息可视化" (Information Visualization). English subtext: "A HISTORY OF ARTIFICIAL INTELLIGENCE — INFORMATION VISUALIZATION".
- Top Right: A boxed section titled "从逻辑模型到生成与推理" (From Logic Generation & Reasoning) with the date range "1943—2025" in large serif font.
- Legend: Small dots indicating categories like Theory, Model, Application, Infrastructure.
Central Radial Visualization (The Core):
- Structure: A complex concentric circular chart (radial timeline).
- Center: Text "1943—2025" and "55 SELECTED MILESTONES".
- Rings: Multiple concentric rings representing decades (1940s to 2020s moving outward/inward depending on specific layer logic, but generally chronological flow).
- Segments: The circle is divided into 6 colored arcs corresponding to historical phases. Labels for these phases appear on the left side as a vertical list:
1. 理论奠基 (Foundations) 1943-1956
2. 符号探索 (Symbolic Exploration) 1957-1973
3. 知识与学习 (Knowledge & Learning) 1974-1999
4. 数据与深度学习 (Data & Deep Learning) 2000-2011
5. 深度学习突破 (Deep Learning Breakthrough) 2012-2019
6. 生成与推理 (Generation & Reasoning) 2020-2025
- Data Points: Numerous small labels radiating outwards or placed along the rings, citing specific milestones. Examples visible include: "McCulloch-Pitts", "Turing Machine", "Perceptron", "ELIZA", "Expert Systems", "Backpropagation", "AlexNet", "AlphaGo", "Transformer", "GPT-3", "ChatGPT", "Sora".
Footer Section:
- Bottom Left: Bar chart titled "01 / 选录节点的年代分布" (Selected Milestones by Decade). Shows counts per decade (e.g., 8 in 1950s, 13 in 2010s).
- Bottom Right: Bubble/Donut chart titled "02 / 节点主题构成" (Milestones by Editorial Category). Four circles sized by count: Theory (9), Model (29), Application (14), Infrastructure (3).
Visual Style: Swiss International Design style. High contrast typography. Use thin lines for connectors. Clean sans-serif fonts for data, serif for titles. Professional, editorial look.
Insert discreet watermark in the lower right corner of the image, vertical text (rotated 90°), written "aipromptlabs.online", Calibri Light font, white color with low opacity (semi-transparent), medium size. Extreme sharpness on the face, fabric texture and typography of the letters. Shot on Canon EOS R5, 50mm f/2.8, studio light.
Usage Instructions & Parameters
Run prompt with modern generative AI model. Adjust details and styling to taste.

ChatGPT-4o

Gemini 2.0 Flash

Midjourney v6.1

ChatGPT-4o

Gemini 2.0 Flash

Creator Discussions & Community Comments 0
Join the AI Prompt Labs community to comment and share variations.