ChatGPT-4o
Digital Art
Published Oct 31, 2026
Mathematical Visualization Infographic Prompt
A prompt template for generating academic and visually appealing mathematical visualization infographics that explain complex concepts through hand-drawn style diagrams. - YouMind

Ai Prompt Labs
@admin • Prompt Engineer
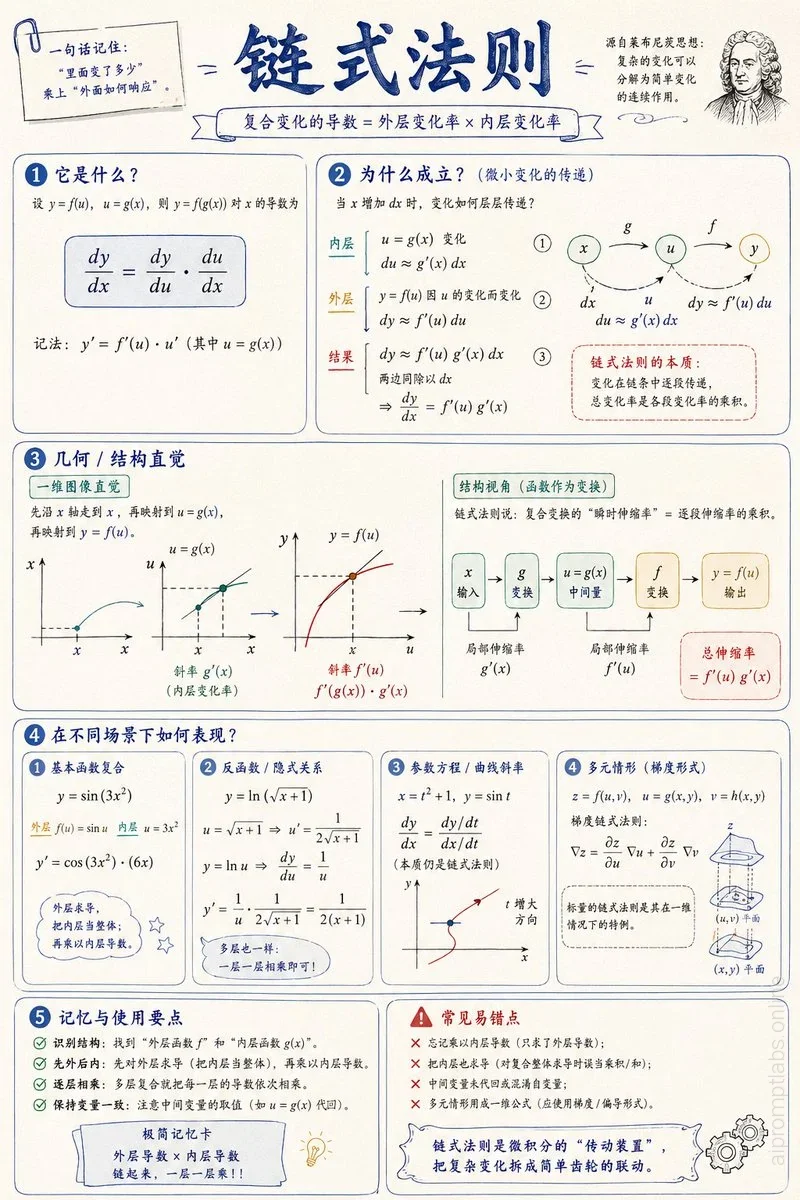
Prompt Instruction Payload
Please create a mathematical visualization infographic about "mathematical concepts/knowledge points" to help readers intuitively understand: what it is, why it holds true, the geometric/structural intuition, and how it behaves in different scenarios. The image should look like a high-quality math lecture handout + hand-drawn educational poster—elegant, clear, and informative without being cluttered. Visual style: vertical or horizontal, clean light-colored paper background, dark blue headings, black/dark gray body lines, accented with a few elegant blue, turquoise, gold, and red colors. Use rounded-corner cards, thin borders, numbered labels, hand-drawn arrows, partial magnification boxes, and summary columns. The overall design should be aesthetic, balanced, and academic, allowing one to immediately grasp the "structure" and "reasoning" behind the concept.
Insert discreet watermark in the lower right corner of the image, vertical text (rotated 90°), written "aipromptlabs.online", Calibri Light font, white color with low opacity (semi-transparent), medium size. Extreme sharpness on the face, fabric texture and typography of the letters. Shot on Canon EOS R5, 50mm f/2.8, studio light.
Usage Instructions & Parameters
Run prompt with modern generative AI model. Adjust details and styling to taste.
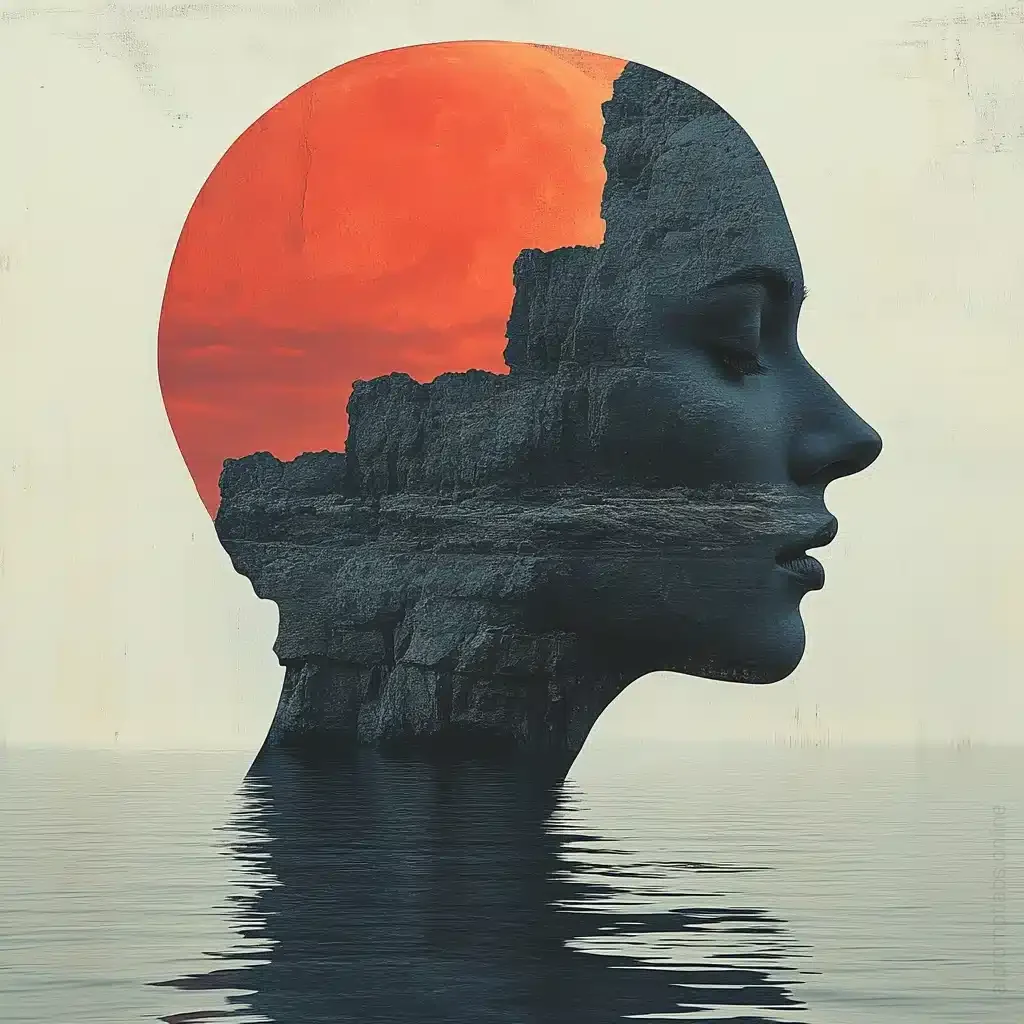
Midjourney v6.1
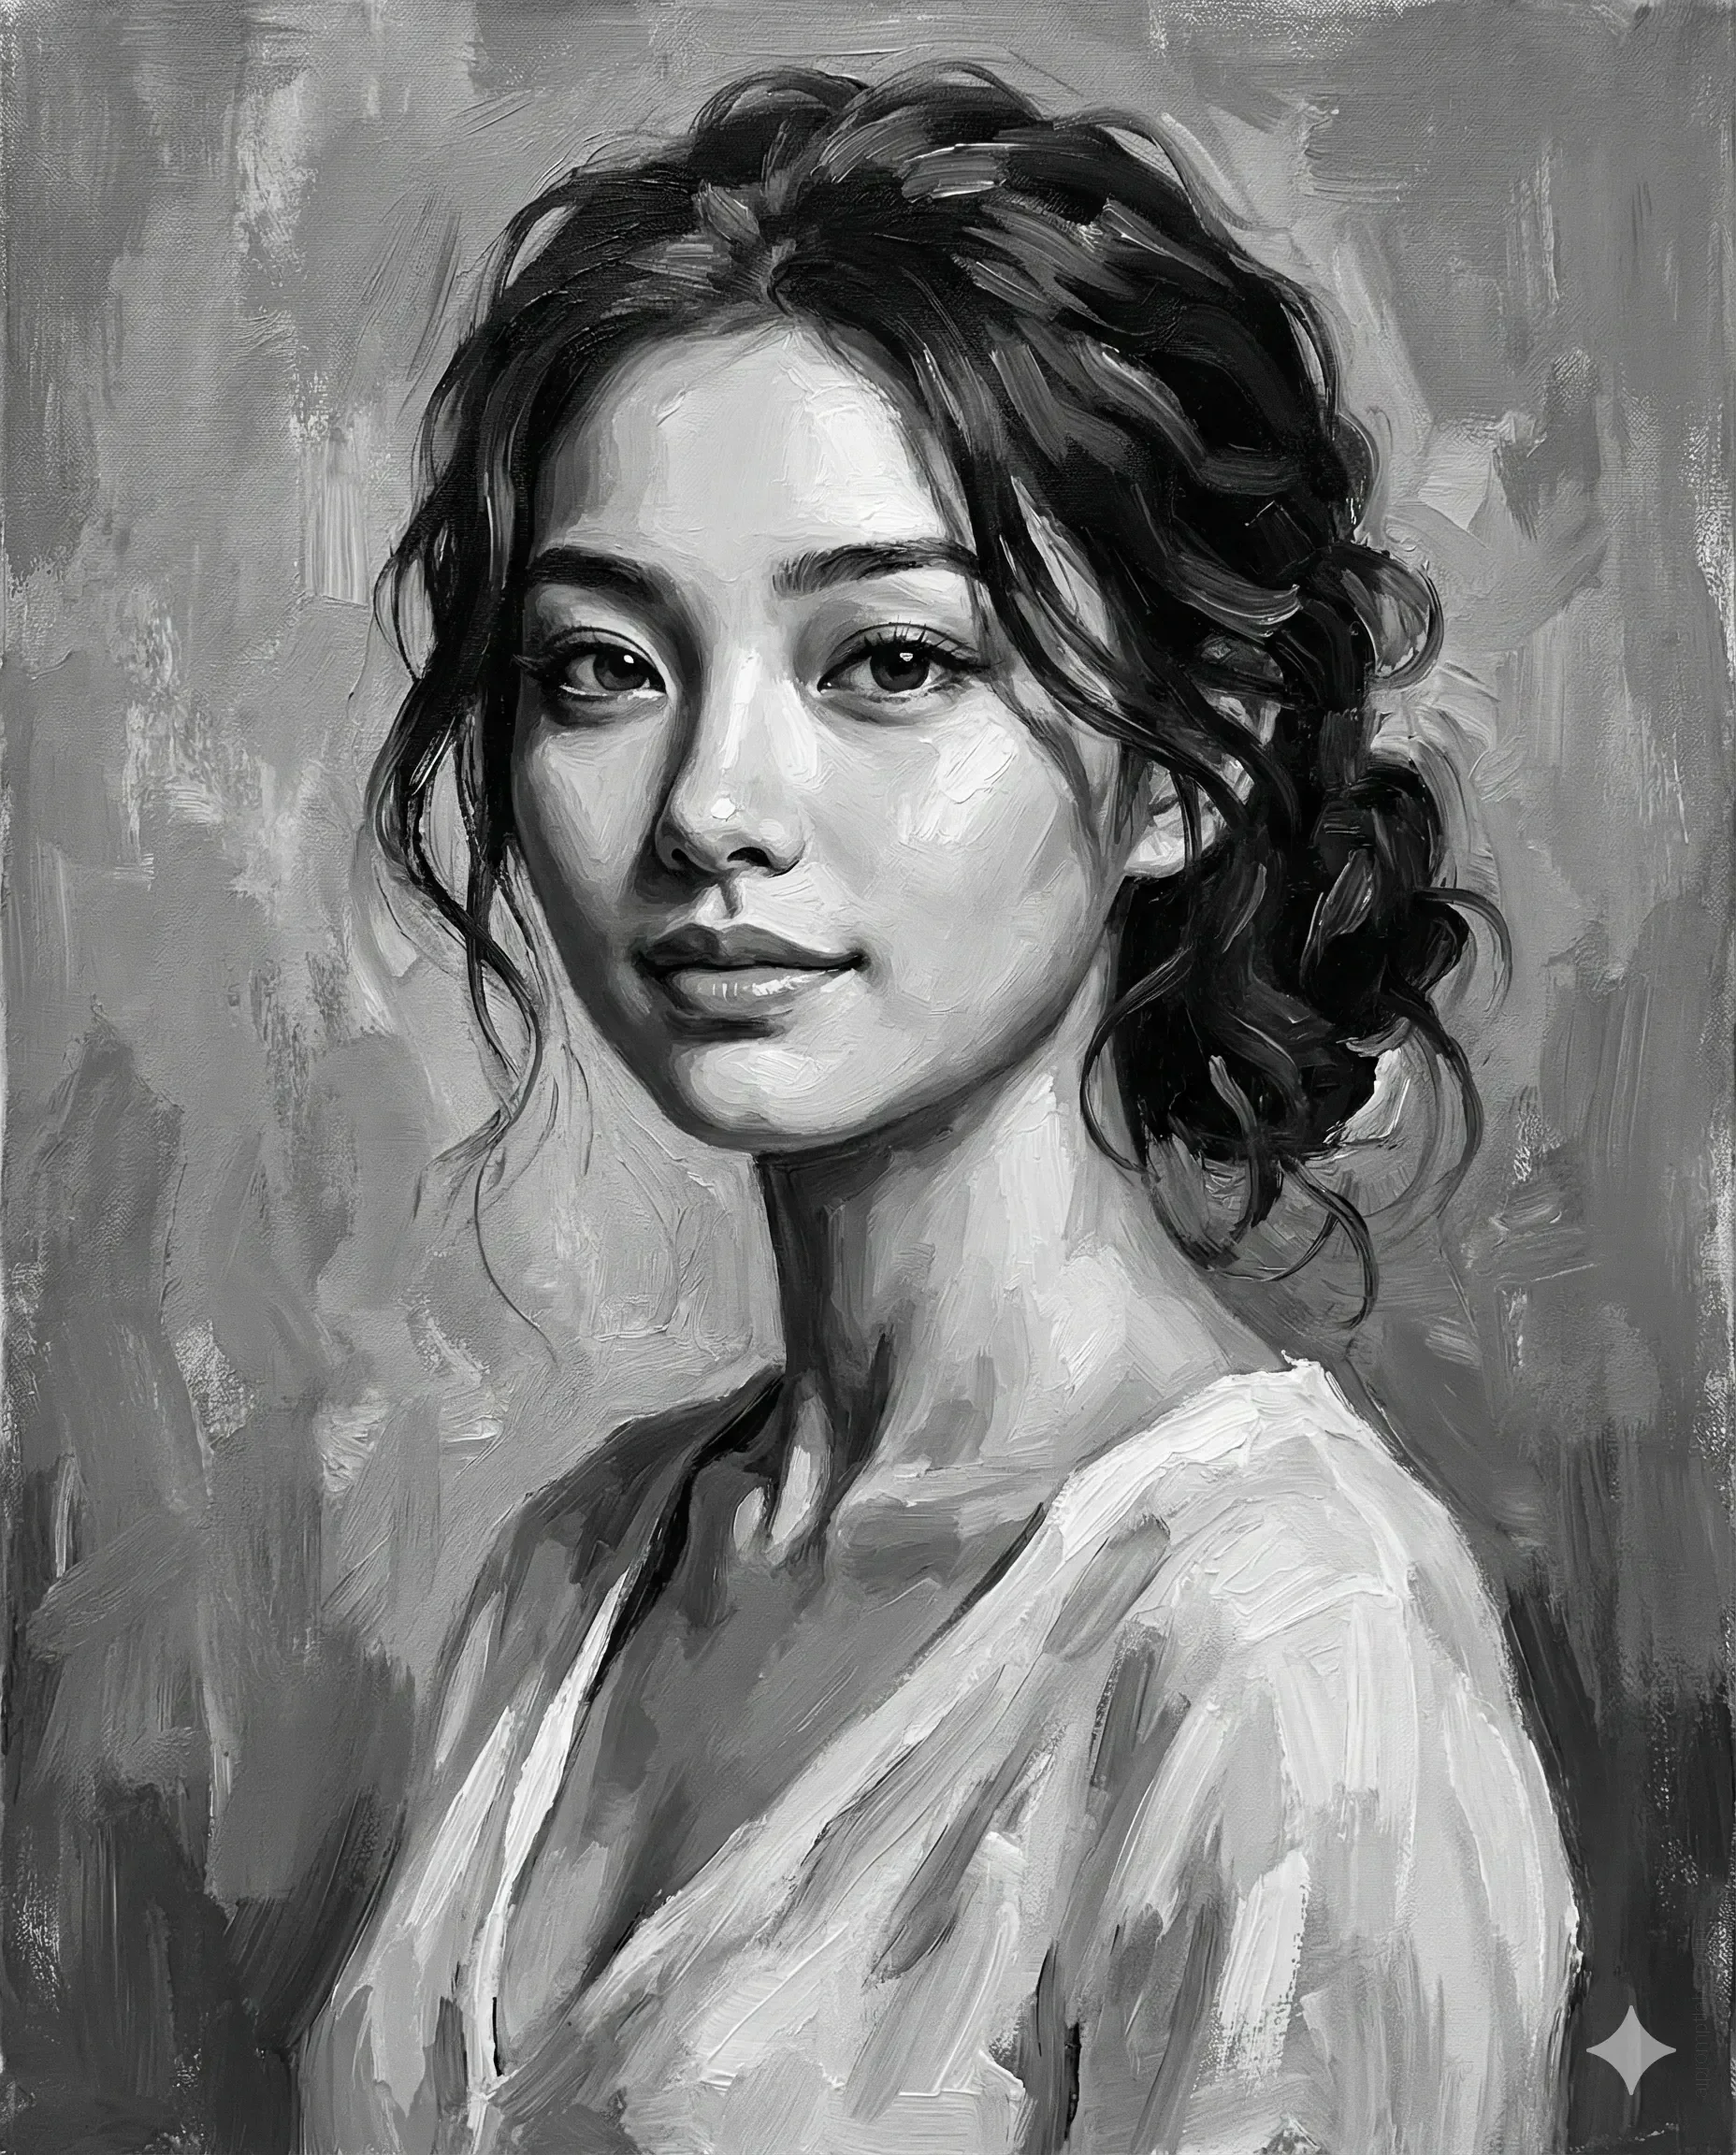
Gemini 2.0 Flash

Midjourney v6.1

ChatGPT-4o
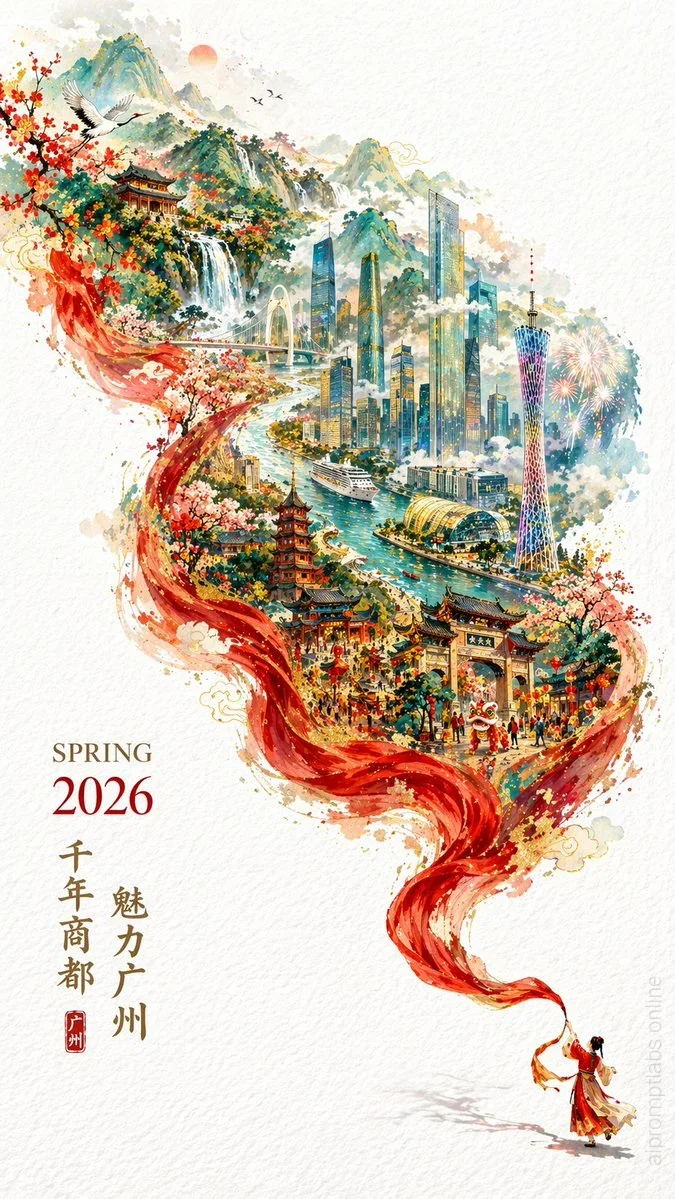
ChatGPT-4o